When you create a graph in Minitab with a lot of data points, Minitab will do its best to locate the tick marks in the axes in a readable way. However, you might want to change the position of tick marks in the axes to better suit your analysis.
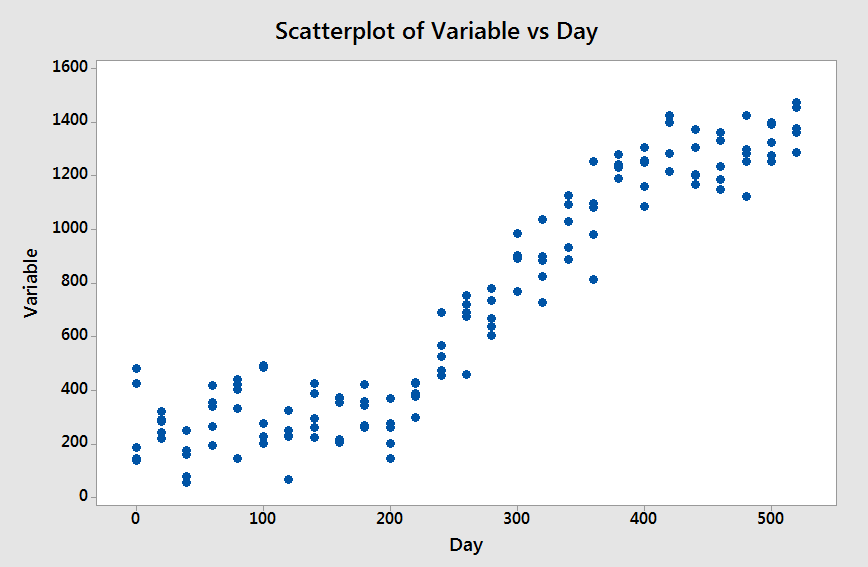
For example, let’s say that you take 5 samples for a given variable every 20 days over a period of 520 days. You create a scatterplot as the one in the following image:
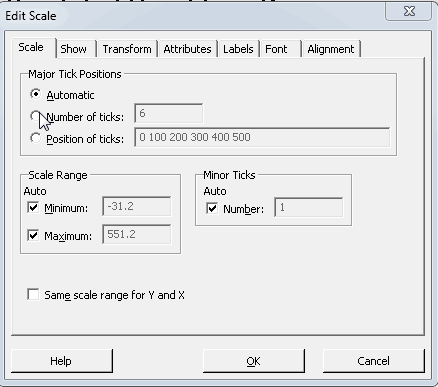
As you can see in the previous graph the ticks are located every 100 days. Let’s say you want to locate the ticks every 20 days. One way of doing this would be to double-click on the X-axis and manually type the values 0, 20, 40,… in the box ‘Position of ticks’:
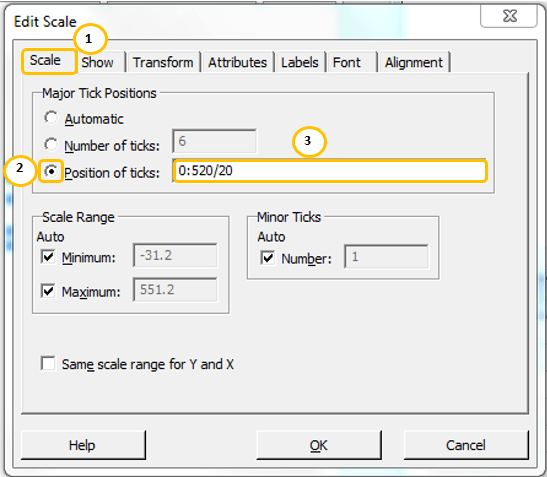
An easier (and faster) way of doing this is to follow these steps:
- Double click the X-axis of the scatterplot
- In the Scale tab, select Position of ticks
- Type 0:520/20 in the box ‘Position of ticks’
This will create the sequence 0, 20, 40, …, 480, 500, 520. See the result below:
In general, a sequence written in the form X:Y/Z will start at X, will continue with increments of size Z until the biggest number less than or equal to Y. See a few examples below:
| X:Y/Z | Sequence |
| 1:20/2 | 1, 3, 5, …, 15, 17, 19 |
| 0:20/2 | 0, 2, 4, …, 16, 18, 20 |
| 1:20* | 1, 2, 3, …, 18, 19, 20 |
* Notice that if you don’t include the increment, Minitab will assume 1.
In addition, you can include numbers outside of the sequence.
Examples:
| Short way | Sequence |
| 1 3 5:60/5 | 1, 3, 5, 10, 15, …, 50, 55, 60 |
| 0:30/5 13 27 | 0, 5, 10, 13, 15, 20, 25, 27, 30 |
Changing the position of tick marks in the axes of Time Series Plots
In time series plots the X-axis is considered as an index value from 1 to the number of observations. However, you can use another variable as a ‘Stamp” for the X-axis.
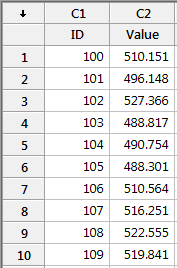
For example, if you want to plot the column ‘Value’ from the following data set:
You will do the following steps:
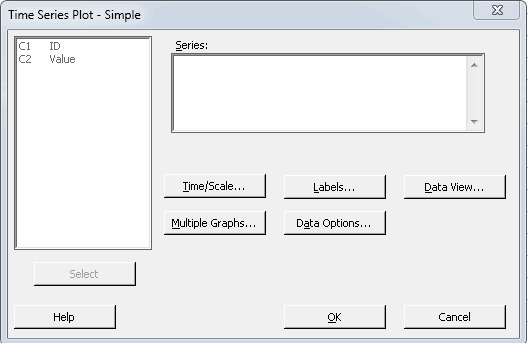
- Go to Graph -> Time Series Plot -> Simple -> Ok
- Double click in the ‘Value’ column to send it to the Series Inputbox and click on ‘Time/Scale’
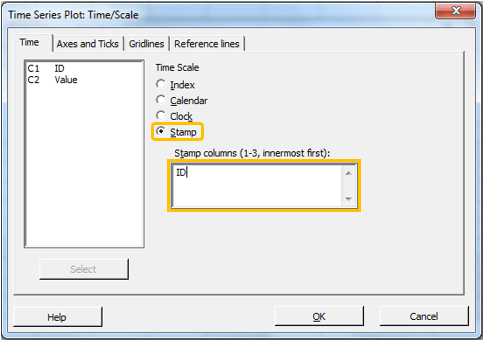
- Select ‘Stamp’ and enter the ID column
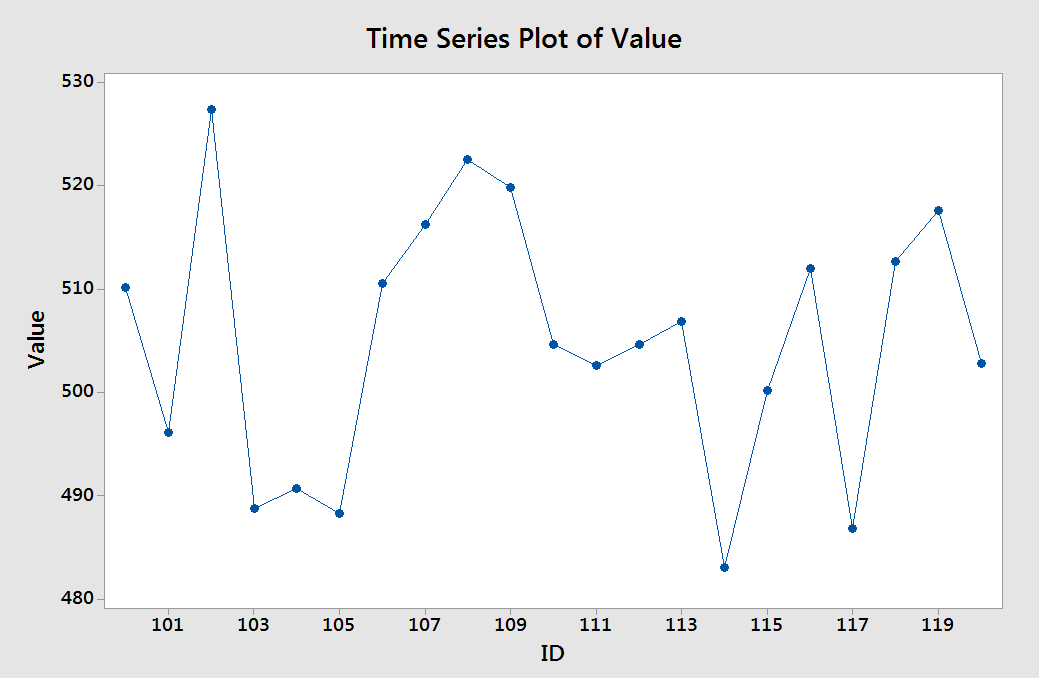
In this specific example, the ID column contain values from 100 to 120. The resulting graph for this data set will look as follows:
If you want to locate the tick marks at 100, 105, …, 120 you should not use the sequence 100:120/5. The reason behind this is that time series plots assume an index variable in the X-axis. Therefore, you should use the corresponding index number for the values you want to show.
The following table show the values for the X-axis and the corresponding index values
| Value for X-axis | Index |
| 100 | 1 |
| 101 | 2 |
| 102 | 3 |
| 103 | 4 |
| 104 | 5 |
| 105 | 6 |
| 106 | 7 |
| 107 | 8 |
| 108 | 9 |
| 109 | 10 |
| 110 | 11 |
| 111 | 12 |
| 112 | 13 |
| 113 | 14 |
| 114 | 15 |
| 115 | 16 |
| 116 | 17 |
| 117 | 18 |
| 118 | 19 |
| 119 | 20 |
| 120 | 21 |
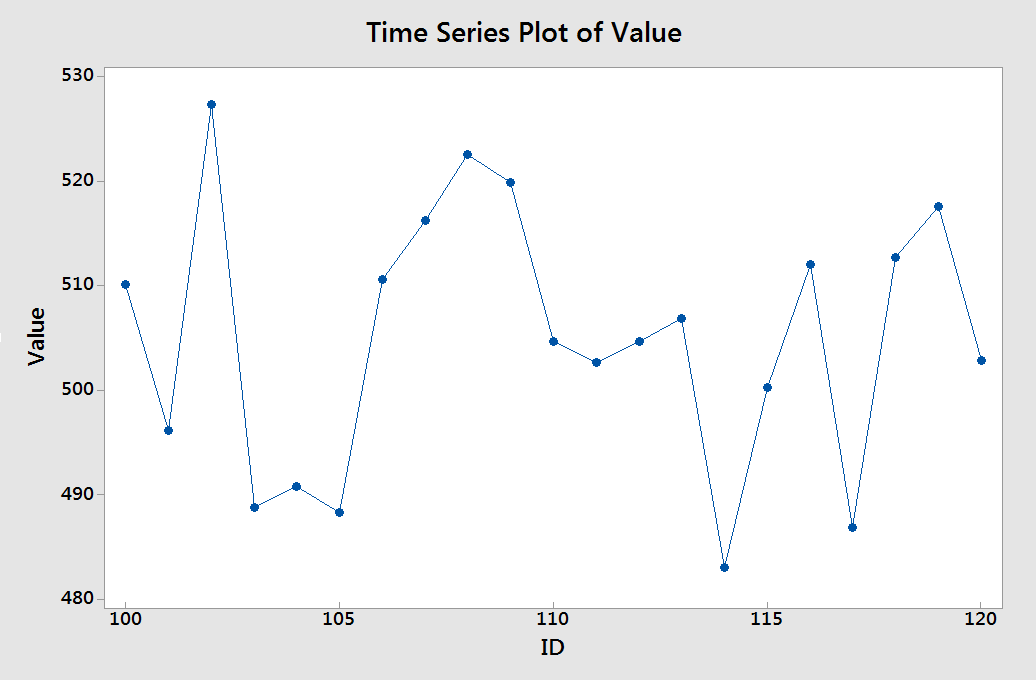
As you can see the corresponding index values are 1, 6, 11, 16, 21; therefore the sequence to use is 1:21/5.
The resulting graph would look like this
Do you know any other tips for tick marks? Please write them in the comments section.
Please go to the top and share this post with people who might benefit.